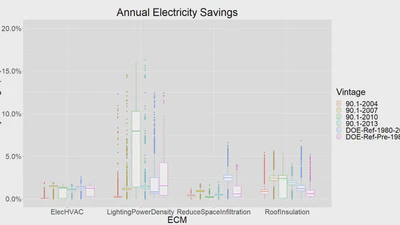
Distribution of potential savings from urban-scale energy modeling of a utility
Comparison of annual electricity savings for different vintages (color) and energy conservation measures.
Brett Bass
•
•
1 min readComparison of annual electricity savings for different vintages (color) and energy conservation measures.
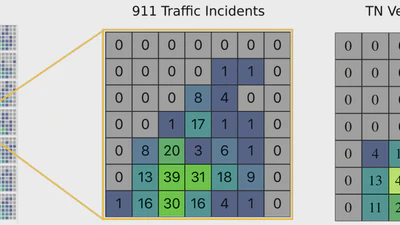
The calendar view shows the incident distribution of a selected dataset over time. Each day’s incidents are displayed as a tile on the calendar. When the tile for a day is …
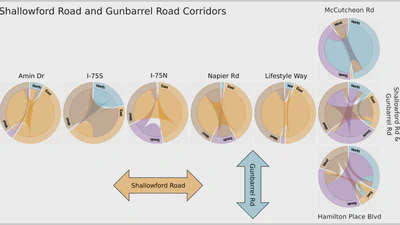
Chord charts for intersection-level visualization for a single day (Tuesday, April 2, 2019) in Chattanooga, Tennessee. The horizontally placed charts represent the intersections …
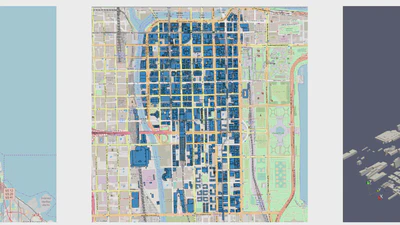
Left: The traffic simulation area (yellow) within the Chicago area (red). Middle: Simulated buildings in the Chicago Loop (blue). Right: 3D rendering of buildings in the Chicago …

Meanshift clustering based Image workload partitioning. Different clusters are represented by different colors. Images belongs to a cluster will be assigned to an independent job. …

Building footprint detection. This depicts detected building footprints, highlighted in purple, by applying a CNN model to satellite imagery.
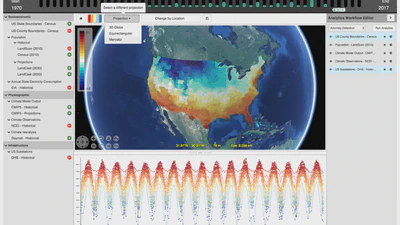
Main view of the user interface of the Energy-Water Nexus Knowledge Discovery Framework, displaying NCEI data on the Web World Wind Globe view. The chart at the bottom shows a …

Progression of video compression results for kinetic energy. From left to right: original quality, encoding only, completely usable (CRF=30), marginally acceptable (CRF=34), and …

A 2AFC discrimination threshold experiment for video compression needs to compare the baseline (uncompressed) image (top left) with many stimuli levels (top right). In the ETK …