A Data-Driven Approach to Nation-Scale Building Energy Modeling
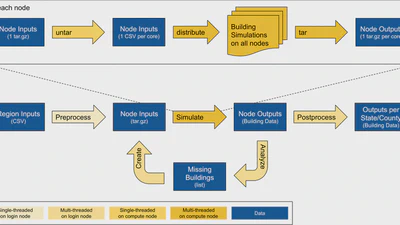
High-level workflow for large-scale building simulation with AutoBEM: The bottom part of the workflow represents the overall workflow while the top portion provides more detail …
High-level workflow for large-scale building simulation with AutoBEM: The bottom part of the workflow represents the overall workflow while the top portion provides more detail …
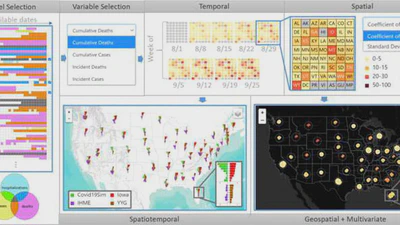
Model selection is performed using a data availability map showing which variables (cases, hospitalizations, deaths) each of the dozens of predictive models includes, and which …
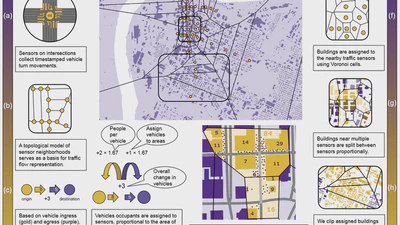
An overview of the methodology presented in this paper, guided by the data workflow. The left-hand side of the figure, (a)-(d), illustrates the traffic data workflow: the data is …
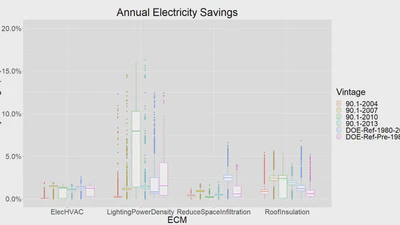
Comparison of annual electricity savings for different vintages (color) and energy conservation measures.
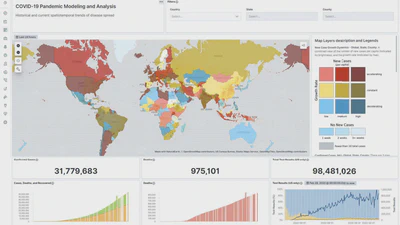
Situational awareness dashboard showing the world-wide spread of COVID-19. The map shows new cases and growth rates worldwide, using a bivariate colormap. The bottom provides some …
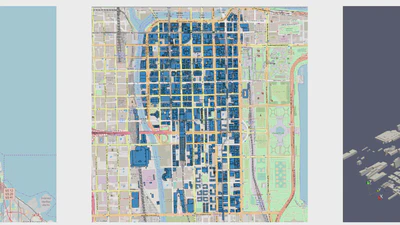
Left: The traffic simulation area (yellow) within the Chicago area (red). Middle: Simulated buildings in the Chicago Loop (blue). Right: 3D rendering of buildings in the Chicago …
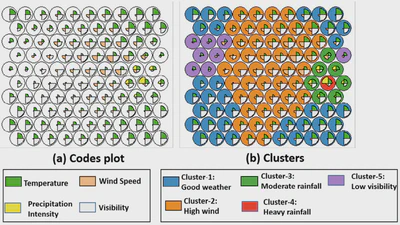
Codes plot after Self-Organizing Maps classification with fan plots in a node representing magnitude of weather attributes (a), and 5 different weather clusters (b).

An initial set of R-Trees is generated once for the raw data. These R-Trees are used to select relevant data for a user query. From this selection, a new set of trees is generated …