Miscellaneous Projects
Interoperability of Legacy Devices: Defined the scope of the workshop, and invited over 20 researchers from buildings, transportation, and the electric grid. Planned the structure …
•
1 min read
Read more
Interoperability of Legacy Devices: Defined the scope of the workshop, and invited over 20 researchers from buildings, transportation, and the electric grid. Planned the structure …
Leadership Co-led a team of 5 researchers for 1.5 years of the project. Mentored a postdoctoral researcher and guided development of interactive visualization tools for the …

An educational talk about using visualization for storytelling.

Panel discussion about good visualization design, with [Project StaSIO](https://projectstasio.ibpsa.us/) members.

Visualization tutorial, specially adapted to the building simulation audience.
Leadership Led the data science team in deriving insights from different sensor data through analysis, visualization, and machine learning. Served as technical lead during the …

An educational talk about good visualization techniques.
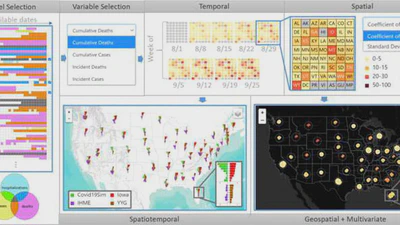
Model selection is performed using a data availability map showing which variables (cases, hospitalizations, deaths) each of the dozens of predictive models includes, and which …
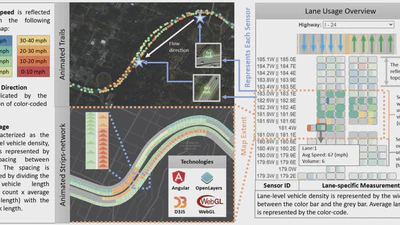
Comparison of an animated trails visualization (used at microscopic scale) and our proposed animated strips-network for visualizing lane usage at mesoscopic scale for a section of …
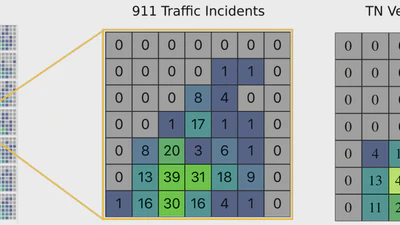
The calendar view shows the incident distribution of a selected dataset over time. Each day’s incidents are displayed as a tile on the calendar. When the tile for a day is …