Paper-Conference

Extreme Weather and the Power Grid: A Case Study of Winter Storm Uri featured image

Extreme Weather and the Power Grid: A Case Study of Winter Storm Uri

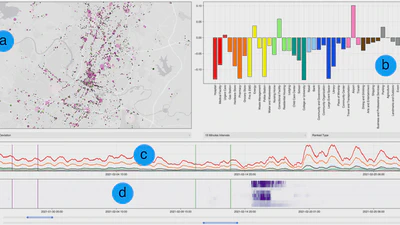
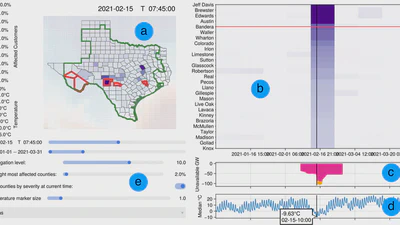
Sample analysis using the OutVis analysis tool. (a) shows the choropleth map of the outage data for a selected state at a specific time, with an optional temperature data overlay. …

Baldwin Nsonga
Read more
Evaluating the Impact of Power Outages on Occupancy Patterns During the 2021 Texas Power Crisis featured image

Evaluating the Impact of Power Outages on Occupancy Patterns During the 2021 Texas Power Crisis

An overview of the MoVis analysis tool. (a) shows the map with circles that indicate high mobility in specific locations. Users can zoom into the map to see building polygons and …

avatar
Andreas Berres
Read more
A Mobile App for Intersectional Traffic Optimization through Real-Time Vehicle-to-Infrastructure (V2I) Communication and Cyber-Physical Control featured image

A Mobile App for Intersectional Traffic Optimization through Real-Time Vehicle-to-Infrastructure (V2I) Communication and Cyber-Physical Control

Overview of the mobile app developed to provide driving recommendations based on vehicle location and the traffic signal state that is managed via a cloud-based communication …

Haowen Xu
Read more
Deploying a Model Predictive Traffic Signal Control Algorithm - A Field Deployment Experiment Case Study featured image

Deploying a Model Predictive Traffic Signal Control Algorithm - A Field Deployment Experiment Case Study

Architecture diagram illustrating the workflow for real-time traffic signal control for our field experiments. GridSmart traffic data and TomTom speeds were preprocessed to feed …

Qichao Wang
Read more
Computer Vision-Enabled Smart Traffic Monitoring for Sustainable Transportation Management featured image

Computer Vision-Enabled Smart Traffic Monitoring for Sustainable Transportation Management

Overview of available traffic signals, camera infrastructure, and parking lot locations on ORNL campus.

Yunli Shao
Read more
A Data-Driven Approach to Nation-Scale Building Energy Modeling featured image

A Data-Driven Approach to Nation-Scale Building Energy Modeling

High-level workflow for large-scale building simulation with AutoBEM: The bottom part of the workflow represents the overall workflow while the top portion provides more detail …

avatar
Andreas Berres
Read more
Generating traffic-based building occupancy schedules in Chattanooga, Tennessee from a grid of traffic sensors featured image

Generating traffic-based building occupancy schedules in Chattanooga, Tennessee from a grid of traffic sensors

An overview of the methodology presented in this paper, guided by the data workflow. The left-hand side of the figure, (a)-(d), illustrates the traffic data workflow: the data is …

avatar
Andreas Berres
Read more
Distribution of potential savings from urban-scale energy modeling of a utility featured image

Distribution of potential savings from urban-scale energy modeling of a utility

Comparison of annual electricity savings for different vintages (color) and energy conservation measures.

Brett Bass
Read more
COVID-19 Joint Pandemic Modeling and Analysis Platform featured image

COVID-19 Joint Pandemic Modeling and Analysis Platform

Situational awareness dashboard showing the world-wide spread of COVID-19. The map shows new cases and growth rates worldwide, using a bivariate colormap. The bottom provides some …

Gautam Thakur
Read more
A Mobility-Driven Approach to Modeling Building Energy featured image

A Mobility-Driven Approach to Modeling Building Energy

Left: The traffic simulation area (yellow) within the Chicago area (red). Middle: Simulated buildings in the Chicago Loop (blue). Right: 3D rendering of buildings in the Chicago …

avatar
Andreas Berres
Read more