Explorative Visualization for Traffic Safety using Adaptive Study Areas
Jan 14, 2021· ,,,,,·
1 min read
,,,,,·
1 min read
Andreas Berres
Haowen Xu
Sarah Tennille
Joseph Severino
Srinath Ravulaparthy
Jibonananda Sanyal
Abstract
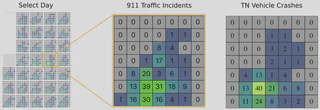
The pressing need to improve traffic safety has become a societal concern in many cities around the world. Many traffic accidents are not occurring as stand-alone events but as consequences of other road incidents and hazards. To capture the traffic safety indications from a holistic aspect, this paper presents a suite of visualization techniques to explore large traffic safety datasets collected from different sources using adaptive study areas which include the whole region (Hamilton County, Ohio, U.S.) as well as smaller sub-areas. In the present study, these data source include (1) Hamilton County’s 911 emergency response data, which includes traffic incidents as well as other types of incidents throughout the county, and (2) Tennessee crash data, which contains only vehicle crashes with more detail on the circumstances of each crash. Both abstract and spatial visualization techniques are used to derive a better understanding of traffic safety patterns for different traffic participants in various urban environments. In addition to the entire region of Hamilton County, safety is examined on the highways, in the downtown area, and in a shopping district east of the city center. It is possible to characterize incidents in the different areas, gain a better understanding of common incident patterns, and identify outliers in the data. Finally, a textured tile calendar is presented to compare spatiotemporal patterns.
Type
Publication
In Transportation Research Record: Journal of the Transportation Research Board