Evaluating the Impact of Power Outages on Occupancy Patterns During the 2021 Texas Power Crisis
Nov 24, 2024· ,,,,,·
1 min read
,,,,,·
1 min read
Andreas Berres
Baldwin Nsonga
Caitlyn Clark
Robert Jeffers
Hans Hagen
Gerik Scheuermann
Abstract
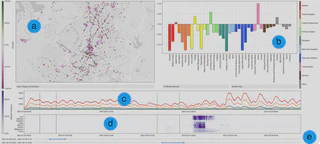
Large-scale power outages, such as those caused by extreme weather events, have a big impact on human behavior. A short power outage is merely a nuisance for most, and may not change people’s locations. An outage that lasts for a few hours can result in spoiled food and medical supplies, and people will have to restock spoiled items. Long outages result in temperatures outside tolerable levels in homes, and may prompt people to acquire supplies, such as generators and gas, or change location. The long outages during Winter Storm Uri in Texas resulted in millions of dollars in property damage due to freezing pipes. This level of damage is expected to result in a sharp increase in supply runs and contractor activity. In this paper, we present a tool to explore differences in visiting patterns before, during, and after power outages. It allows to compare different points of interest like medical facilities, grocery stores, hardware stores, and other types of businesses.
Type
Publication
In IEEE EnergyVis 2024: 4th Workshop on Energy Data Visualization