An Evaluation of the Ocean and Sea Ice Climate of E3SM Using MPAS and Interannual CORE-II Forcing
Apr 13, 2019·, ,,,,,,,,,,,,,,,·
1 min read
,,,,,,,,,,,,,,,·
1 min read
Mark R. Petersen
Xylar S. Asay-Davis
Andreas Berres
Qingshan Chen
Nils Feige
Matthew J. Hoffman
Douglas W. Jacobsen
Philip W. Jones
Mathew E. Maltrud
Stephen F. Price
Todd D. Ringler
Gregory J. Streletz
Adrian K. Turner
Luke P. Van Roekel
Milena Veneziani
Jonathan D. Wolfe
Phillip J. Wolfram
Jonathan L. Woodring
Abstract
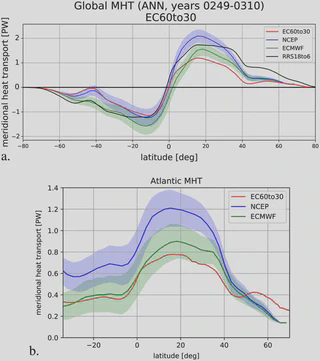
The Energy Exascale Earth System Model (E3SM) is a new coupled Earth system model sponsored by the U.S Department of Energy. Here we present E3SM global simulations using active ocean and sea ice that are driven by the Coordinated Ocean-ice Reference Experiments II (CORE-II) interannual atmospheric forcing data set. The E3SM ocean and sea ice components are MPAS-Ocean and MPAS-Seaice, which use the Model for Prediction Across Scales (MPAS) framework and run on unstructured horizontal meshes. For this study, grid cells vary from 30 to 60 km for the low-resolution mesh and 6 to 18 km at high resolution. The vertical grid is a structured z-star coordinate and uses 60 and 80 layers for low and high resolution, respectively. The lower-resolution simulation was run for five CORE cycles (310 years) with little drift in sea surface temperature (SST) or heat content. The meridional heat transport (MHT) is within observational range, while the meridional overturning circulation at 26.5°N is low compared to observations. The largest temperature biases occur in the Labrador Sea and western boundary currents (WBCs), and the mixed layer is deeper than observations at northern high latitudes in the winter months. In the Antarctic, maximum mixed layer depths (MLD) compare well with observations, but the spatial MLD pattern is shifted relative to observations. Sea ice extent, volume, and concentration agree well with observations. At high resolution, the sea surface height compares well with satellite observations in mean and variability.
Type
Publication
In Journal of Advances in Modeling Earth Systems