EPIsembleVis: A geo-visual analysis and comparison of the prediction ensembles of multiple COVID-19 models
Nov 1, 2021·
 ,,·
1 min read
,,·
1 min read
Haowen Xu
Equal contribution
Andreas Berres
Equal contribution
,Gautam Thakur
Jibonananda Sanyal
Supriya Chinthavali
Abstract
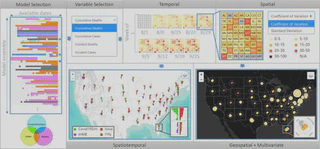
We present EPIsembleVis, a web-based comparative visual analysis tool for evaluating the consistency of multiple COVID-19 prediction models. Our approach analyzes a collection of COVID-19 predictions from different epidemiological models as an ensemble and utilizes two metrics to quantify model performance. These metrics include (a) prediction uncertainty (represented as the dispersion of predictions in each ensemble) and (b) prediction error (calculated by comparing individual model predictions with the recorded data). Through an interactive visual interface, our approach provides a data-driven workflow for (a) selecting and constructing the COVID-19 model prediction ensemble based on the spatiotemporal overlap of available predictions of multiple epidemiological models, (b) quantifying the model performance using both the uncertainty of each model prediction ensemble, and the error of each ensemble member that represents individual model predictions, and (c) visualizing the spatiotemporal variability in the projection performance of individual models using a suite of novel ensemble visualization techniques, such as the data availability map, a spatiotemporal textured-tile calendar, multivariate rose chart, and time-series leaflet glyph. We demonstrate the capability of our ensemble visual interface through a case study that investigates the performance of weekly COVID-19 predictions, which are provided through the COVID-19 Forecast Hub UMass-Amherst Influenza Forecasting Center of Excellence [47] for the United States and United States Territories. The EPIsembleVis tool is implemented using open-source web technologies and adaptive system design, rendering it interoperable with Elasticsearch and Kibana for automatically ingesting COVID-19 predictions from online repositories, and it is generalizable for analyzing worldwide projections from more epidemiological models.
Type
Publication
In Journal of Biomedical Informatics, Journal Name: Journal of Biomedical Informatics