Modeling and Simulation

Transportation featured image

Transportation

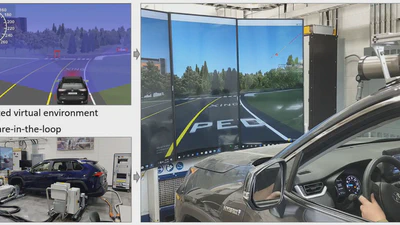
How can we make traffic safer and more efficient? Transportation accounts for 30% of energy consumption world-wide, and traffic delays are at an all-time high. In the United …

Read more
Human Behavior featured image

Human Behavior

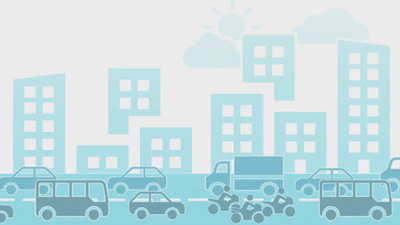
Why should we study human behavior? Picture this. It’s an average day. You wake up, brush your teeth, make coffee, and get ready for work. If you have a kid, you get them ready to …

Read more
Energy featured image

Energy

What do I like about energy? Energy is such a broad topic! After spending many years on the energy end use side of things (traffic and building energy), working at NREL has …

Read more
Buildings featured image

Buildings

Why should we care about buildings? Buildings account for a significant percentage of total energy use world-wide (about 24% in 2023). Building energy modeling provides an …

Read more
A Data-Driven Approach to Nation-Scale Building Energy Modeling featured image

A Data-Driven Approach to Nation-Scale Building Energy Modeling

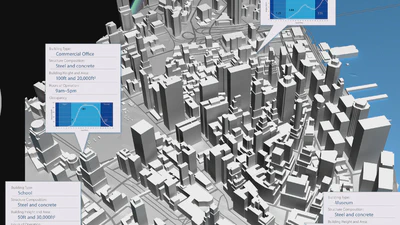
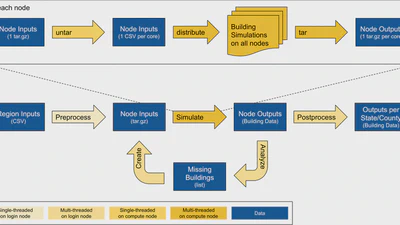
High-level workflow for large-scale building simulation with AutoBEM: The bottom part of the workflow represents the overall workflow while the top portion provides more detail …

avatar
Andreas Berres
Read more
EPIsembleVis: A geo-visual analysis and comparison of the prediction ensembles of multiple COVID-19 models featured image

EPIsembleVis: A geo-visual analysis and comparison of the prediction ensembles of multiple COVID-19 models

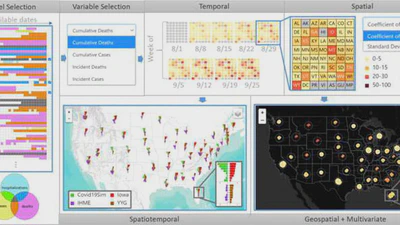
Model selection is performed using a data availability map showing which variables (cases, hospitalizations, deaths) each of the dozens of predictive models includes, and which …

Haowen Xu
Read more
Generating traffic-based building occupancy schedules in Chattanooga, Tennessee from a grid of traffic sensors featured image

Generating traffic-based building occupancy schedules in Chattanooga, Tennessee from a grid of traffic sensors

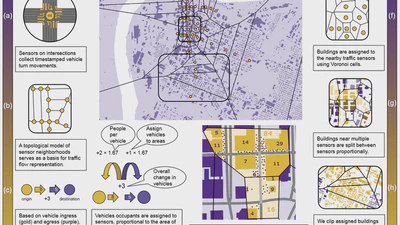
An overview of the methodology presented in this paper, guided by the data workflow. The left-hand side of the figure, (a)-(d), illustrates the traffic data workflow: the data is …

avatar
Andreas Berres
Read more
Distribution of potential savings from urban-scale energy modeling of a utility featured image

Distribution of potential savings from urban-scale energy modeling of a utility

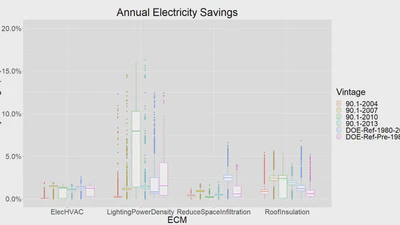
Comparison of annual electricity savings for different vintages (color) and energy conservation measures.

Brett Bass
Read more
COVID-19 Joint Pandemic Modeling and Analysis Platform featured image

COVID-19 Joint Pandemic Modeling and Analysis Platform

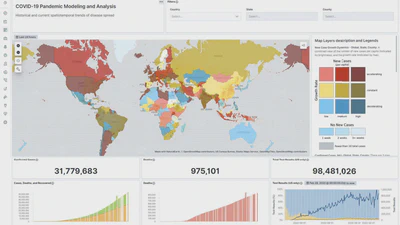
Situational awareness dashboard showing the world-wide spread of COVID-19. The map shows new cases and growth rates worldwide, using a bivariate colormap. The bottom provides some …

Gautam Thakur
Read more