A Mobility-Driven Approach to Modeling Building Energy
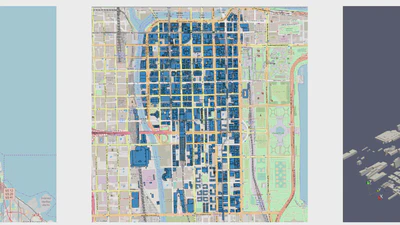
Left: The traffic simulation area (yellow) within the Chicago area (red). Middle: Simulated buildings in the Chicago Loop (blue). Right: 3D rendering of buildings in the Chicago …
Left: The traffic simulation area (yellow) within the Chicago area (red). Middle: Simulated buildings in the Chicago Loop (blue). Right: 3D rendering of buildings in the Chicago …
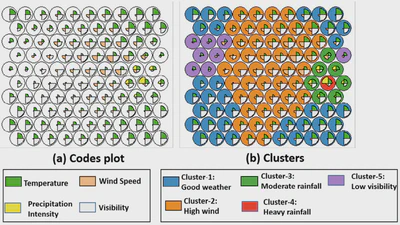
Codes plot after Self-Organizing Maps classification with fan plots in a node representing magnitude of weather attributes (a), and 5 different weather clusters (b).
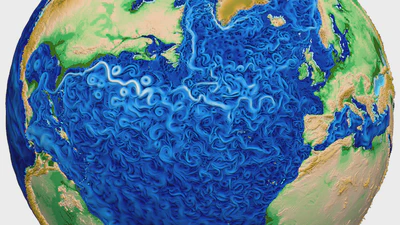
Ocean Simulation Development The Model for Prediction Across Scales (MPAS) is an effort to model oceans, land ice, sea ice, and atmosphere for use in climate research and weather …

An initial set of R-Trees is generated once for the raw data. These R-Trees are used to select relevant data for a user query. From this selection, a new set of trees is generated …