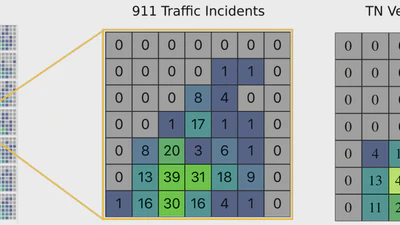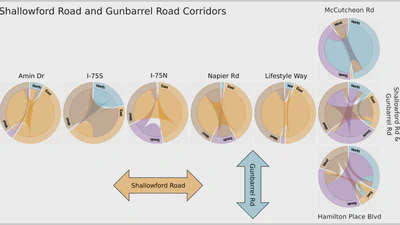
Continuous Emulation and Multiscale Visualization of Traffic Flow Using Stationary Roadside Sensor Data
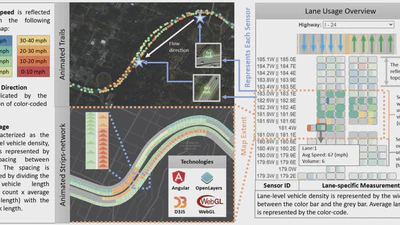
Comparison of an animated trails visualization (used at microscopic scale) and our proposed animated strips-network for visualizing lane usage at mesoscopic scale for a section of …
Haowen Xu
•
•
1 min read